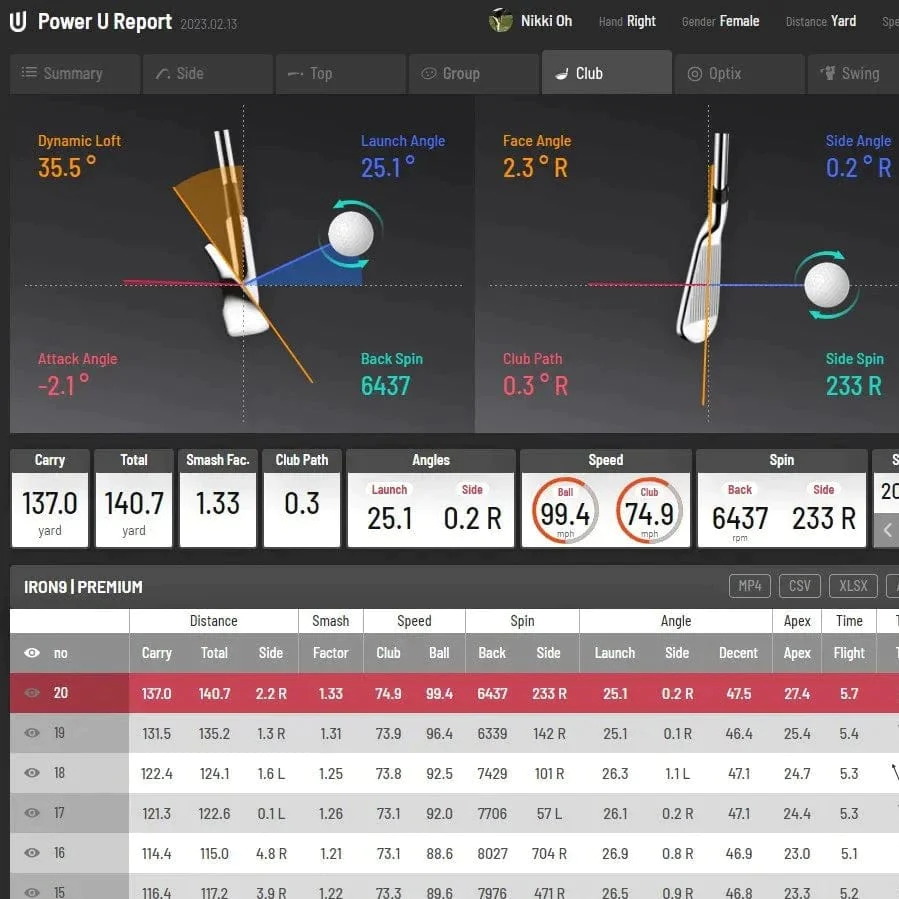
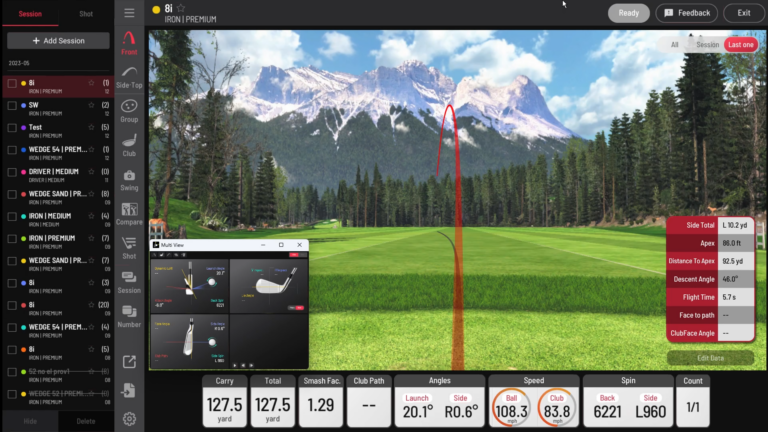
Understanding golf launch monitor data is the first step to knowing how to to analyze your game. If you don’t understand the data, you could actually make your golf swing worse!
Launch monitors provide a wealth of swing and ball flight data to help golfers analyze and improve their games.
But if you’re new to using launch monitors, the array of metrics and terminology can seem overwhelmingly complex. What do all of those numbers and data points actually mean?
This complete guide breaks down all of the key golf launch monitor metrics in simple terms, including smash factor, launch angle, spin rate, carry distance, and more.
With a solid understanding of the meanings and relationships behind the data, you can start leveraging launch monitors to their full potential.
Let’s dive into demystifying those baffling launch monitor numbers once and for all!
Launch Monitor Basics – What Metrics are Measured?
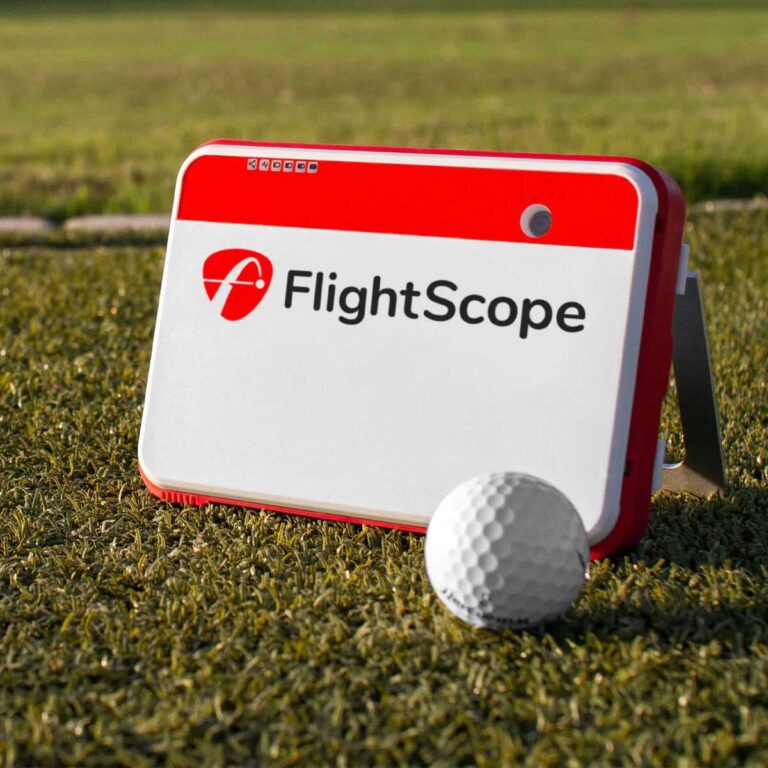
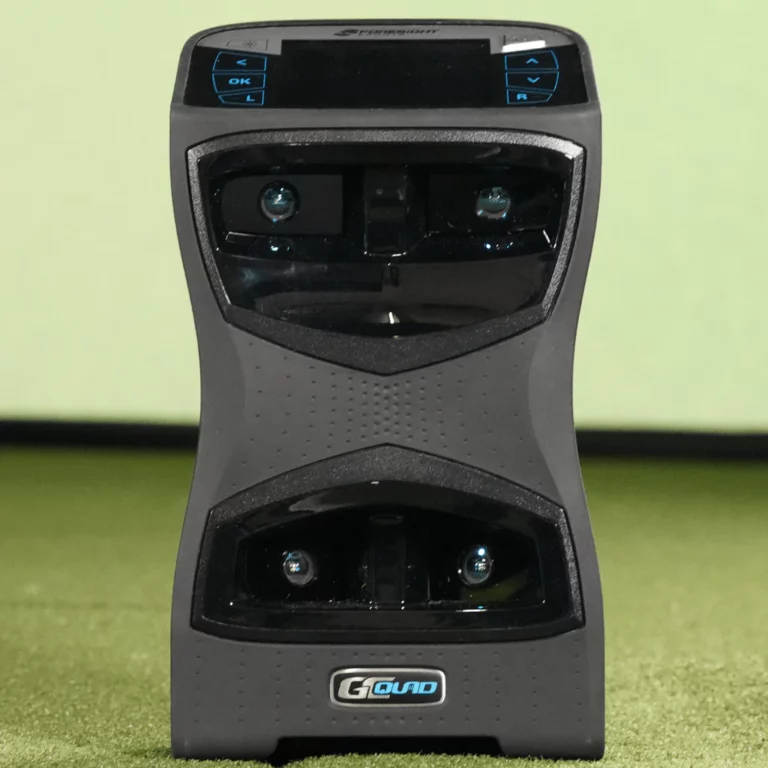
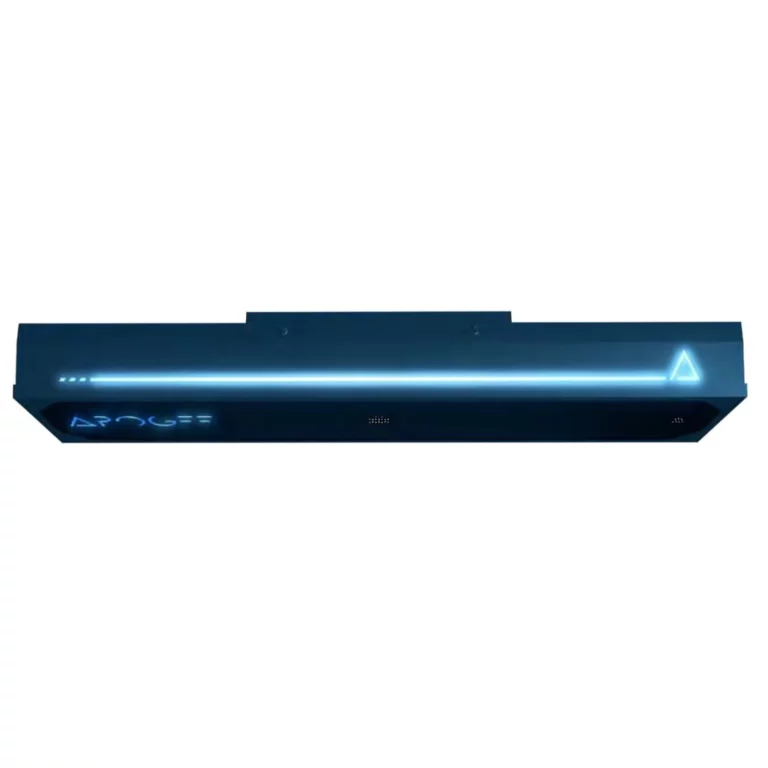
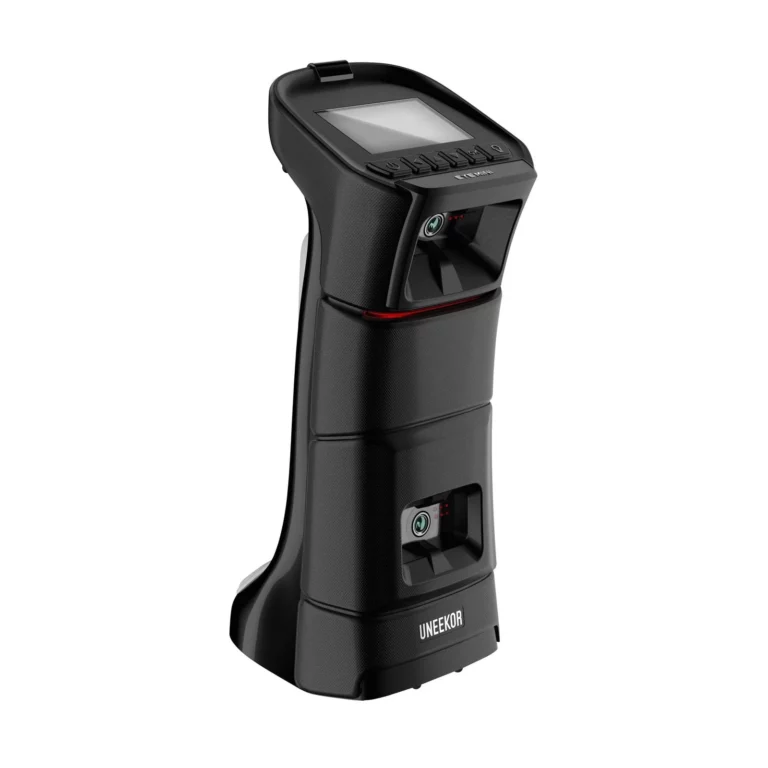
Before defining the data, it helps to understand at a high level what launch monitors actually measure when you hit a shot. Advanced launch monitors use radar or camera sensors to precisely track details of both your club movement and the golf ball immediately after impact.
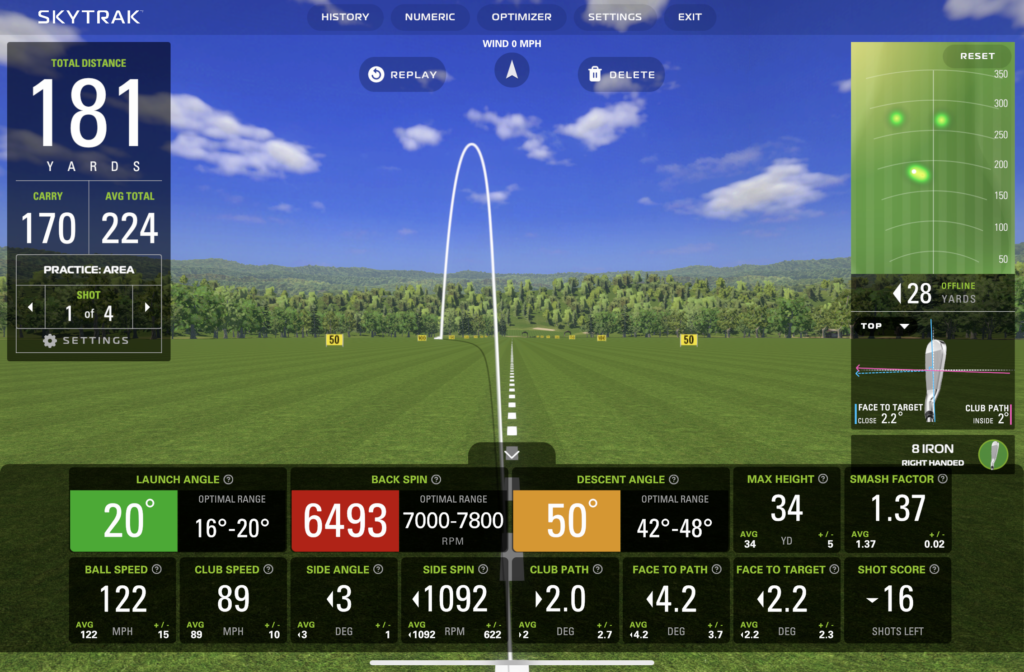
This comprehensive set of club and ball data helps golfers truly understand their driving distance, shot dispersion, swing efficiency, and more. But again, the data can only help improve your game if you comprehend what the numbers represent.Â
How To Improve At Golf Using Launch Monitor Metrics
Understanding golf launch monitor data is the first step in your journey to become a better golfer. But how do you use that data to improve?
Most golfers get hung up on this step. They finally understand what the key metrics mean, but then don’t know how to use those metrics to improve.
Don’t worry, we’ve got your covered! Read our detailed post HOW GOLF LAUNCH MONITOR METRICS CAN IMPROVE YOUR GAME to understand how to take these metrics and actually know how to improve your game!
Understanding Launch Monitor Data
Let’s break down each critical launch monitor metric in plain English. Not all launch monitors capture the exact same set of data, so you need to check before purchasing a launch monitor to see what each one captures.
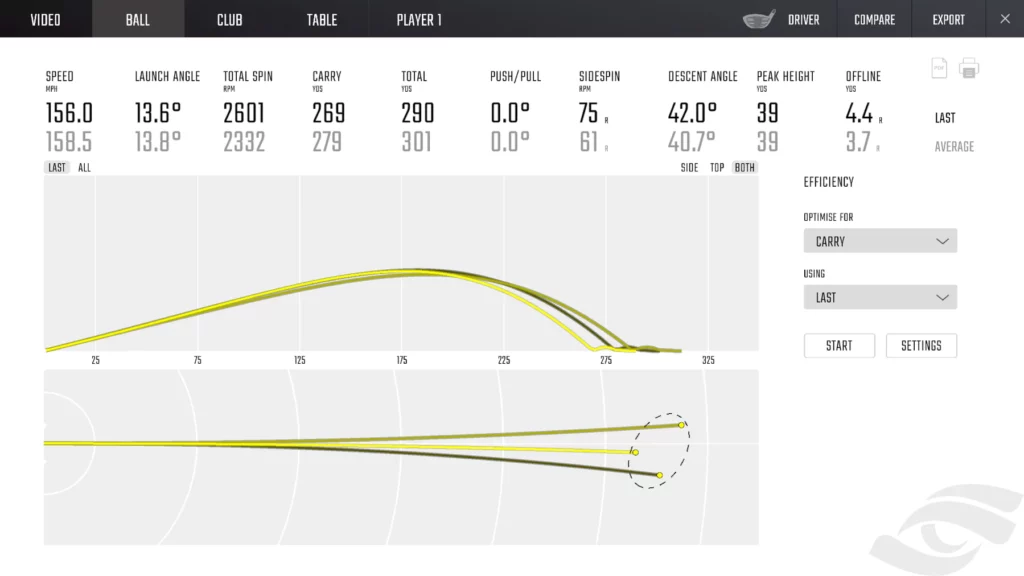
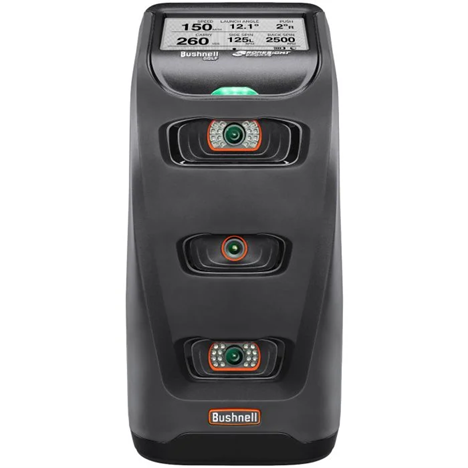
In addition, several launch monitors require subscriptions (Bushnell Launch Pro, for instance) to unlock certain metrics.
BALL DATA
For the ball itself, launch monitors measure some/all of the following:
- Carry Distance
- Total Distance
- Vertical Launch Angle
- Horizontal Launch Angle
- Spin Tilt Axis
- Spin Rates
- Back Spin
- Side Spin
- Total Spin
- Ball Speed
- Launch Direction
- Curve
Carry Distance
The launch monitor combines the above metrics like ball speed, launch angle, and spin rate to estimate both your carry distance and total distance.
Carry distance is the raw distance traveled through the air before the ball hits the ground.
Total Distance
Total distance factors in rollout after landing. The formula is Carry Distance + Rollout = Total Distance.
These numbers help you understand real-world distances and gaps for each golf club based on your unique swing and launch characteristics. Keep in mind simulators only estimate true on-course distance when dialed in accurately.
Focus on your carry distance gaps and total distance trends over time rather than obsessing over absolute totals. Improvement starts with understanding your personal yardages.
Vertical Launch Angle
The launch angle is a critical metric that measures the vertical angle your golf ball takes off the clubface at the moment of impact, measured in degrees lofted above horizontal.
Launch angle has a major influence on overall carry distance and peak trajectory height. An ideal launch angle for maximizing driver distance is 12-15 degrees. Launching too low (under 10 degrees) leads to short shots that lack carry distance, while launching too high (over 16 degrees) leads to balloon-like shots that peak too soon.
To optimize launch angle, consider the loft of your driver, your attack angle, and the resulting spin rate together. Changes to any of these factors will impact your launch angle. Finding the right combinations to consistently launch in the ideal window is key for distance.
Horizontal Launch Angle
Horizontal launch angle measures the side-to-side trajectory in degrees caused by club path affecting shot shape. More negative angles create draw spin, while positive angles create fade or slice spin. Horizontal launch angle combines with vertical angle for true ball flight.
Spin Tilt Axis
Spin tilt axis describes the orientation of the golf ball’s rotation by measuring the tilt of the spin axis at launch. It indicates the direction of sidespin. For a perfect straight shot, spin tilt axis would be 0 degrees.
Spin Rates – The Impact of Backspin and Sidespin
Spin rate is a measurement of the revolutions per minute (RPMs) of backspin on the golf ball immediately after impact. It also measures sidespin in the case of sliced or hooked shots.
Optimal backspin creates a penetrating ball flight that maximizes carry distance before dropping. Excessive backspin reduces distance by balloon the ball up too high, increasing drag and reducing roll out.
Moderate backspin of around 2200-2800 RPMs is ideal for most drivers. As club loft increases, so does spin potential. Short irons and wedges naturally generate more backspin, in the 6500-8500 RPM range due to their sharper loft.
High amounts of sidespin (over 500 RPMs) indicate a significant slice or hook spin component affecting accuracy. Analyzing your spin rates can help improve equipment fitting and shot shaping ability.
Back Spin
Backspin creates lift and carry on shots. It is measured in revolutions per minute (RPMs) of the golf ball after impact. The ideal backspin is in the 2000-3000 RPM range for drivers, increasing through the irons and wedges. Too much or too little backspin reduces distance.
Side Spin
Side spin measured in RPMs indicates sideways rotation on the ball at launch causing shots to curve left or right. Slice shots have positive side spin, hooks have negative side spin. Minimal side spin is desirable for straight ball flights. Driver side spin should be under 400 RPM.
Total Spin
Total spin measures the complete revolutions per minute (RPM) of the golf ball after being struck. This factors together backspin and sidespin on non-straight shots. The ideal driver spin is 2200-2800 RPM. Spin rate influences carry distance and trajectory.
Ball Speed
Ball speed is the velocity of the golf ball after being struck measured in miles per hour (mph). Faster ball speeds result in longer shot distances. Ball speed is heavily influenced by having the correct swing technique and equipment to maximize clubhead speed through impact.
Here are 1-2 paragraph explanations of the requested launch monitor ball data metrics:
Launch Direction
Launch direction indicates the initial horizontal trajectory the ball takes after leaving the clubface. It is measured in degrees left or right of the target line.
Launch direction combines with club path, face angle, and spin axis to influence the overall shot shape, causing draws, fades, pushes or pulls depending on equipment and swing mechanics.
Curve
Curve measures the total sideways curve or bend in the ball flight path in yards offline from the original launch direction. Curve is most dramatically impacted by sidespin which can bend shots left or right.
However other factors like launch angle and speed also play a role in curvature. Analyzing curve can help correct persistent slices, hooks, or other mishits creating excessive shot bend.
CLUB DATA
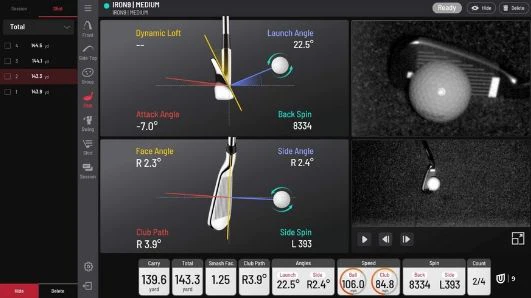
Critical club metrics gathered include:
- Attack Angle
- Club Path
- Club Head Speed
- Face Angle
- Face to Path
- Dynamic Loft
- Spin Loft
- Swing Plane
- Swing Direction
- Low Point
- Impact Height
- Impact Offset
- Dynamic Lie
- Smash Factor
Attack Angle – Striking Up vs Down on the Ball
The attack angle measures the angle of approach between the clubhead and ball at impact, either upward or downward.
With driver shots, the attack angle should be slightly positive, ideally around +2 to +4 degrees. This adds loft for better launch angles.
A negative attack angle with driver often lowers launch through ‘de-lofting’ at impact. However, negative attack angles in the -2 to -4 range can be optimal for long irons and wedges to control trajectory.
Monitor your attack angle and adjust where necessary to find the right impact dynamics for your club type and swing characteristics.
Club Path – Tracking Swing Direction
Club path indicates the direction the clubhead was moving horizontally through the impact zone in relation to your target line.
If club path aligns perfectly with your target line, it would read 0 degrees. But slight variances lead to pushes, pulls, draws and fades.
For example, a club path of +5 degrees outside the target line would typically produce a push or slice. A club path of -4 degrees inside the target line would often generate a draw or hook.
Work to maintain a neutral, square club path aligned directly at your target for consistent impact. Path and face angle together heavily influence shot shape.
Club Head Speed
Club head speed indicates the speed of the clubhead in miles per hour (mph) at the moment of impact with the ball. Clubhead speed is a key metric used for proper club fitting and selection based on your unique swing velocity. PGA Tour average driver club head speed is 113 mph. Average male clubhead speed with a driver is around 90-105 mph.
Face Angle
Face angle represents the orientation of the clubface relative to the target line at impact. An open face points right of target creating slice spin, while a closed face points left of target creating draw spin. Neutral face angle aligns with target for straight shots.
Face to Path
Face to path measures the difference between the clubface angle and the club path at impact. If face angle aligns perfectly with path, face to path would be 0 degrees. Any variance between clubface orientation and swing path will impact shot shape.
Dynamic Loft
Dynamic loft indicates the actual loft on the clubface at the moment of impact, which can vary from the static loft based on factors like attack angle. Dynamic loft changes with each swing and dictates launch angle and spin.
Spin Loft
Spin loft is the difference between dynamic loft and launch angle. It represents the amount of effective loft actually imparting backspin on the ball at launch. Spin loft is a key factor determining total spin rate.
Swing Plane
Swing plane represents the angle of the swing arc in relation to the ground. Swing plane varies by golfer and club, with driver swings being more vertical and iron swings more rounded. Consistency leads to better impact.
Swing Direction
Swing direction measures the full 3D path of the swing through impact. While club path shows horizontal direction, swing direction also incorporates vertical angles and rotation on multiple axes capturing complete motion.
Low Point
Low point locates the lowest part of the swing arc where the clubhead bottoms out. Consistently hitting the low point just after ball contact promotes consistent ball-first impact with irons.
Impact Height
Impact height indicates where on the face strikes are making contact – high, low, or center. Monitoring impact height helps correct poor impact and mishits leading to energy and distance loss.
Impact Offset
Impact offset measures horizontal distance between impact point on the face and the center of the club face. Heel or toe impacts show offset affecting accuracy. Center face strikes align for optimal energy transfer.
Dynamic Lie
Dynamic lie shows the actual lie angle of the club at impact after accounting for attack angle adjustments. Like dynamic loft, dynamic lie often varies from static lie values. Important for proper club fitting.
Smash Factor – Understanding Impact Efficiency
Smash factor is an important launch monitor measurement that indicates how efficiently you are transferring energy from your swing into the golf ball at the moment of impact.
Smash factor is calculated by dividing your ball speed by your clubhead speed:
Smash Factor = Ball Speed / Clubhead Speed**
For example, if you had a clubhead speed of 90 mph and a ball speed of 135 mph, your smash factor would be 1.5.
A higher smash factor means more energy was delivered to the ball. The tour level smash factor is around 1.4 to 1.5. A lower smash factor indicates energy and velocity were lost at impact, likely due to a mishit or poor strike.
Maximizing your smash factor leads directly to greater ball speed and distance. Strive to make consistent, solid impact with the center of the clubface whenever possible.
Putting Metrics
 Putting metrics include some of the data already defined above plus the following putting-specific data points (some of these metrics are specific to Trackman).
- Backswing Time
- Stroke Length
- Forward Swing Time
- Skid Distance
- Roll Speed
- Speed Drop
- Roll %
- Effective Stim
- Side
- Break
- Entry Speed Distance
- Elevation
- Slope %
- Slope % Rise
- Stimp (flat)
Backswing Time
Backswing time measures the duration of the putter’s backstroke prior to the forward stroke impacting the ball. It is often measured in milliseconds or seconds. Tracking backswing time can aid consistency in pace and rhythm on the greens.
Stroke Length
Stroke length indicates the total distance the putter travels through the entire putting stroke from backswing to impact. It is typically measured in inches or feet. Stroke length affects both distance control and accuracy. Monitoring stroke length promotes solid tempo.
Forward Swing Time
Forward swing time captures the specific duration of the forward portion of the putting stroke leading up to ball impact. Like backswing time, it is measured in milliseconds or seconds. Consistent forward swing time is key for controlling putting pace and distance.
Analyzing putter backswing time, forward swing time, and overall stroke length provides data to refine your putting tempo, rhythm and consistency for better performance on the greens.
Skid Distance
The total yardage the ball slides or skids before beginning to roll forward.
Roll Speed
The velocity of the ball once it transitions from skidding to true forward rolling.
Speed Drop
The percentage decrease in velocity from initial ball speed to roll speed.
Roll %
The proportion of the total putt distance that was rolled rather than skidded.
Effective Stim
The calculated speed of an individual putt based on average deceleration as it rolls.
Side
The total lateral distance in yards from the target at the point of reaching entry speed.
Break
The sideways curve or bend after launch before reaching entry speed.
Entry Speed Distance
The total yardage in a straight line from launch to where entry speed of 1.68 mph is reached.
Elevation
The vertical height difference between launch point and entry speed point.
Slope %
The average horizontal angle of the green’s incline.
Slope % Rise
The average vertical angle of the green’s slope.
Stimp (flat)
The calculated general green speed based on average putt deceleration.
Interpreting and Applying Launch Monitor Data
Now that you understand what all of those confusing launch monitor numbers and metrics actually represent in plain English, you can start benefiting from the feedback.
While data can seem complicated at first, remember launch monitors provide objective, measurable ways to understand your swing mechanics and equipment in a feedback loop.
Learn to make small, incremental changes based on what the data reveals as strengths and weaknesses. Monitor your improvement over time as swing changes become ingrained.
With practice, launch monitor analytics will become second nature. Let the numbers guide you down the fastest path to reaching your golfing potential.
Conclusion
Focus on trends and improvement over time rather than demanding perfection from every swing. With some familiarity, launch monitor data becomes incredibly useful feedback. Let the numbers guide you to your best golf ever!
Frequently Asked Questions
What do the numbers mean on a golf launch monitor?
How do you read golf data?
How do launch monitors calculate distance?
What is a good smash factor?
How much spin should you get with a 7 iron?
What do the numbers in golf mean?
What is a golf launch monitor?
How does a golf launch monitor work?
What can I learn from a golf launch monitor?
How can a golf launch monitor help improve my game?
What are some of the key metrics explained by a launch monitor?
What is swing speed and ball speed?
How can I interpret the launch monitor’s data to improve my golf game?
What are some common mistakes to avoid when using a golf launch monitor?
Are all launch monitors the same?
Can a golf simulator provide the same data as a launch monitor?
Founder of TheLuxeGolf, I am an avid golfer with a single-digit handicap with over 20 years of experience playing golf. I use my analytics education from Georgia Tech to help me research and write the best articles on luxury & premium golf products! I love how analytics has seeped into every aspect of golf and how it can be used to provide incredible insights into your game. In my time, I’m either writing about golf, watching golf, or playing golf!

